Investigating the value of urban living 2010
Investigating the value of urban living 2010
Report summary
1.Background and purpose of study
The purpose of this study is to determine the types of value urban residents see in relation to what aspects of their town or where in town they live. In terms of the value of towns, many books with rankings of towns people want to live in have been published, but the indices serving as the basis for calculations are often economic indices, such as land price and rent, or indices that quantitatively evaluate the environment in terms of equipment and facilities, such as the number of facilities per unit of population or gross floor area of households. Needless to say, although these indices are useful for calculating rankings because they allow for quantitative comparisons, environments that residents find attractive are not limited to size or economic evaluations, and considerations of whether they can live comfortably (that is, the quality of town) are important.
While keeping in mind these issues, this study aims to: individually interview urban residents using an “Evaluation Grid Method” to ask about where in their towns they like or consider good, and why; clarify the structure of evaluations of areas based on the opinions of residents; and propose physical environments or factors that should be provided to create towns that make residents want to stay.
2. Research team
This study was conducted under the following research system.
・Research planning and coordination
Masashi SOEDA (LLP Human Environment Design Laboratory, Ground Planner, PhD (Engineering))
・Research and survey planning, design, and administration and analysis
Naoko WAKABAYASHI Living Environment Studio ACT Inc., CEO, PhD (Engineering))
・Research supervisor
Shinichi, SENTODA (Research Institute for High-Life, Senior Researcher)
3. Study method
In this study, we conducted a survey of individual interviews based on the “Evaluation Grid Method” as a method for structurally understanding the “true needs” that individual urban residents seek for areas and locations by associating these needs with specific locations and elements. The “Evaluation Grid Method” is an interview method that has been improved and developed based on interview methods developed in the field of clinical psychology and is widely used to understand a variety of needs (requests) associated with environment, etc. The premise of this method is the “Personal Construct Theory”, which posits that human beings “each have a unique ‘cognitive structure’, which is a mechanism of understanding and judgment, and they try to understand external information obtained through sight, sound, and other senses by processing information with this mechanism to determine the actions they should take and predict outcomes.” The “cognitive structure” in this case is a “hierarchical structure” having specific understandings such as “a spacious or non-spacious skyline” at the bottom, sensory understandings such as “feels or does not feel liberating” in the middle, and more abstract value judgments such as “able to unable to relax” at the top. The Evaluation Grid Method can be described as a method aiming to selectively pick up only certain aspects (i.e., the “evaluation structure”) related to the surveyed “evaluation” within the individual cognitive structure.
In general procedures of the evaluation grid method, respondents are first asked to think about multiple subjects to determine “which one they like”, and are then asked for the reasons for their judgment criteria. In this study, however, we set the subjects that the respondents were asked to evaluate as “locations within their residential areas that they consider good and like” and asked for reasons such as “why they like it” and “why they consider it good” for each location determined as being “liked” and “good”. This was because we wanted to have the respondents pick several “locations that they consider good and like” and it was awkward to have the respondents rank these locations. In addition, we also asked whether the locations were used in their daily lives, whether they served as destinations, and whether they were one of the reasons why they liked their towns.
Assuming that evaluation structures vary between residential areas, we picked the Sangen-Jaya area in Setagaya ward (a location where commercial and residential areas, as well as new buildings and traditional downtown shopping districts coexist, and there is a mixture of both old and new houses and various shop sizes) and the Konan area in Minato ward (a new town where large-scale redevelopment is taking place; the number of high-rise apartments has recently been increasing and many residents are new to the area) as our surveyed areas that we believed to have different characteristics. In addition, taking differences in life stages into consideration, we included various generations, including seniors and nurturers, among the respondents.
We conducted surveys in the Konan areas in July and September of 2009 and in the Sangen-Jaya area in September and October. The interview survey was conducted by one interviewer and one note-taker, and we spent about one hour for each respondent.
4. Discussion of contents of interviews
4-1. Profile of respondents
Regarding the profiles, there were significant differences between the areas. We can interpret these differences as indicating not only differences in the samples used this time but also differences in the resident profiles of the areas as a whole. In Konan, most of the respondents were already retired (seniors) or were homemakers. Of the respondents, 30 percent were nurturers, and their children (the youngest sibling) were all preschoolers. On the other hand, in Sangen-Jaya, more than 70 percent of the respondents were full-time workers and none of them were homemakers or retired. Nurturers accounted for almost half of the respondents, and the average age of the children was higher than that in Konan.
4-2. Reasons for area selection
The main reasons for selecting both areas were “good accessibility (close to urban center, convenient transportation to work and school, easy transportation to parents’ homes, easy to move around, etc.)”. In addition, a common finding for both areas was that few people chose the area for the region’s “brand name” or the reputation of the region. As described above, however, many people in Konan had moved in from far regions or were seniors, and they chose “apartments in the urban center” rather than “residential areas”. On the other hand, many people in Sangen-Jaya were nurturers who had moved in from neighboring areas, and there was a noticeable trend in which they chose Sangen-Jaya for the following reasons: “having a lot of greenery despites its location in the urban center” and “wanting to raise kids while having neighborly ties”.
4-3. Perception of areas
This was the area of greatest difference between Konan and Sangen-Jaya. The area that people imagined as the extent of the region in Konan varied, including “the high-rise apartment where I live”, “the apartment where I live and neighboring areas accessible on foot”, and “areas accessible within about 10 minutes by car (including Toyosu and Odaiba)”. On the other hand, the people’s perception of the area in Sangen-Jaya formed a pattern in which respondents belonged to “Taishido/Setagaya line”, “Daizawa/Shimokitazawa” or “Mishuku/Ikejiri”, and the frameworks of each area were considerably distinct.
4-4. Comprehensive evaluation of areas
The comprehensive evaluations in both Konan and Sangen-Jaya were good. The majority of people “liked” their residential areas and stated that they “have an emotional attachment to the area”. It was also common in both areas that many people did not expect anything more than good accessibility before moving in but began liking the area once they started living there. Especially in Konan, many had negative impressions of the area before moving in, including a perception of the area as “not a residential area” or “having a bad environment”, but we saw many cases where these impressions turned into positive value after they started living there.
However, the elements people value vary depending on the areas. In Konan, “feeling liberated” (close to the ocean and has a spacious skyline) is highly valued, aspects such as shopping were evaluated as “inconvenient”. In Sangen-Jaya, along with good accessibility, convenience for shopping and economic potential were highly valued and the comprehensive evaluation for the area was that “there is no area that is more comfortable than here”. The results regarding human relationships were opposed as well, indicating an urbanized environment in Konan and a traditional environment in Sangen-Jaya.
4-5. Review of differences between individuals and areas
Using data on individual attributes, words, and locations people liked, we reviewed the differences between individuals and areas by conducting a correspondence analysis. For differences between individuals, we reviewed differences based on gender, life stage, whether they had children, years in residence, and working style. Although the differences could be organized in terms of life stages such as the “nurturer generation” and generations with children that were “preschoolers” or “attending school”, the differences between individuals in the senior generation were great and there were no noticeable trends. In addition, the results showed that there were no significant differences in other attributes such as gender or years in residence. As for differences between the areas, common words or locations were found in these two areas, and other items distinctive to each area only varied in two directions and there were no significant differences. In addition, we observed many patterns in which words picked to describe reasons for liking a location or characteristics were used to describe locations under completely different classifications. That is, as a whole, the results indicate that common types of attractiveness and value exist in different areas or locations.
5. Analysis of evaluation structure
5-1. Creation of overall network diagram
The main purpose of this study is to show the evaluation structure related to locations that people consider “good” and “like”. First, we organized the results from individual interviews into a network diagram for each respondent while focusing on the configuration of the hierarchical aspects of their opinions. Then, according to the procedures described below, we removed the segments between each respondent and integrated and organized the results into a single network diagram.
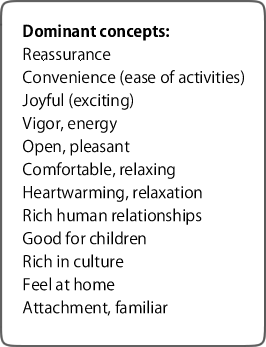
1) Extraction of dominant concepts
Parties involved in the survey were gathered to look at the network diagrams for each respondent and extract and organize common dominant concepts.
2) Creation of category list
・We divided and reorganized all of the individual data based on each of the dominant concepts selected in step 1.
・We divided the concepts into three groups, including the top (the subject is a person), middle (the subject is a town or location) and bottom (specific locations), and created a category list.
3) Creation of overall network diagram
・Based on the category list, we summarized the information and created a single “network diagram” for all of the information.
The dominant concepts described in this network diagram can be considered “the types of value and attractiveness that urban residents seek for areas”. The fact that we could easily summarize these concepts without any omissions suggests that the type of value and attractiveness required for residential areas share many common denominators across areas and people. However, we also discovered from this network diagram that even for the same dominant concepts, the related aspects of the specific locations (locations that people consider “good” and “like”) are often different.
Example: “Convenience”: “Everything can be obtained, compact”
Konan: Toyosu (artificial and large-scale shopping mall)
Sangen-Jaya: Chazawa Street shopping district (like a traditional downtown shopping district)
That is, we can say that there are common requirements for residential areas (value and attractiveness) shared across different areas and people, although the images of these requirements (how they look) vary depending on the characteristics of each area.
5-2. Proposal of “5 locations” required for urban living
Finally, we further organized and integrated the dominant concepts of the overall network diagram in order to easily report the results of the survey we conducted this time, and we proposed an illustration of “5 locations” required for urban living. These 5 locations are characterized by the following key words: (1) wandering into, hanging out, and gathering; (2) free and easy, doing nothing, and relaxing; (3) exciting, discoveries, and fun; (4) active, free, and easygoing; and (5) culture, rich, and feelings. We attempted to describe the “type of value and attractiveness that urban residents seek for areas” through illustrations in order to visually imagine them.
As mentioned before, even for the same dominant concepts, the related aspects of the specific locations (locations that people consider “good” and “like”) are often completely different. Therefore, it should be noted that the scenes we proposed this time are not always appropriate for the illustrations of each of the “5 locations”. However, we can say that the “5 locations” represent in concrete form the “true needs” that urban residents seek for areas from a certain point of view. In contrast with the quantitatively measurable urban indices (land prices, population, average income, number of facilities per unit area, etc.) used for traditional rankings of areas where people want to live, our concepts are characterized by the use of key words describing value spoken as actual opinions obtained through the perspectives of residents. Looking at other towns, locations that seem to have similar types of concepts, value, and functions for each of the “5 locations” can be found in other towns. For example, by actively finding, collecting, and organizing such data and building up a vocabulary, it is highly possible to develop the “5 locations” as a city evaluation tool that represents the voice of residents.
6. Further challenges and directions for development
As for future challenges, it is necessary to further verify the validity of the “5 locations” that we have proposed this time. We believe that it is necessary to conduct questionnaire surveys on the “5 locations” for residents in various urban environments to find out whether there are any locations that apply to the “5 locations” in their residential areas, or whether they have other locations that they consider “good” or “like”, as well as to conduct similar surveys in towns with different characteristics from those of the towns we targeted this time, including, for example, “historic and traditional towns” and “traditional downtown areas”. In addition to such verification, we hope to publicize the “5 locations”, including the background and methods of this proposal and the significance of this concept, to the media and local governments in order to raise awareness of our efforts among people involved in urban planning and development and to broaden the use of existence values as indices for measuring the values of urban living.